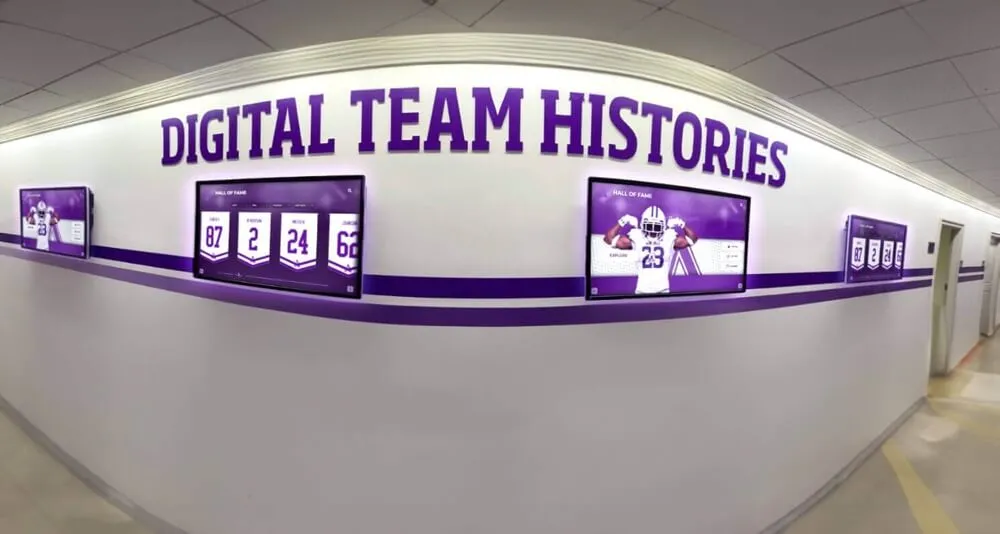
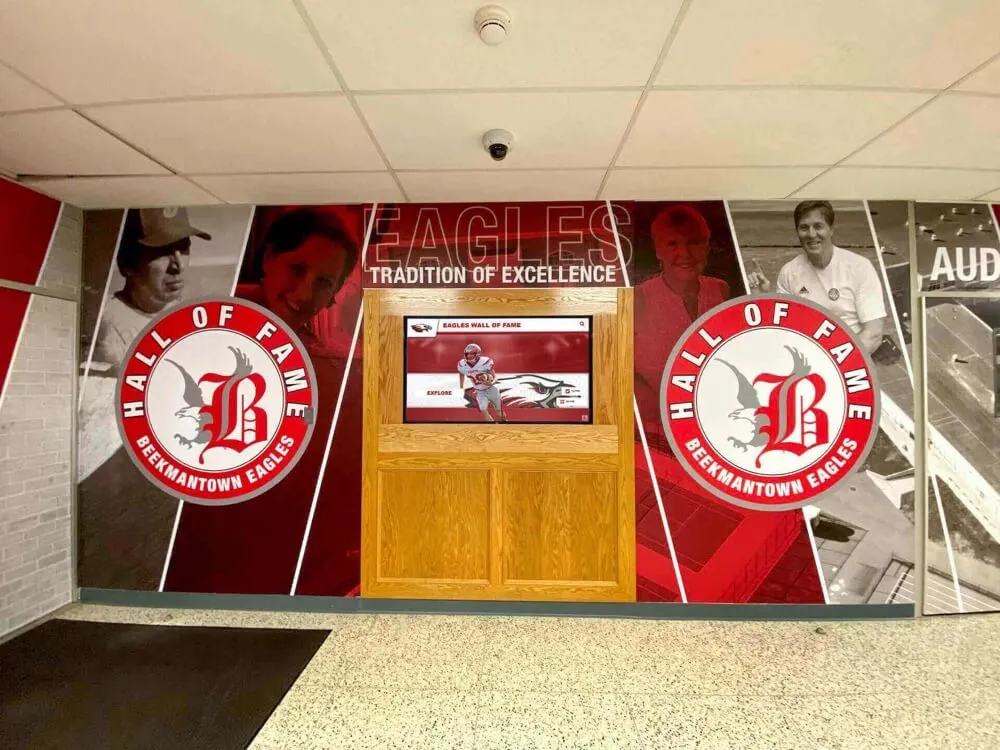
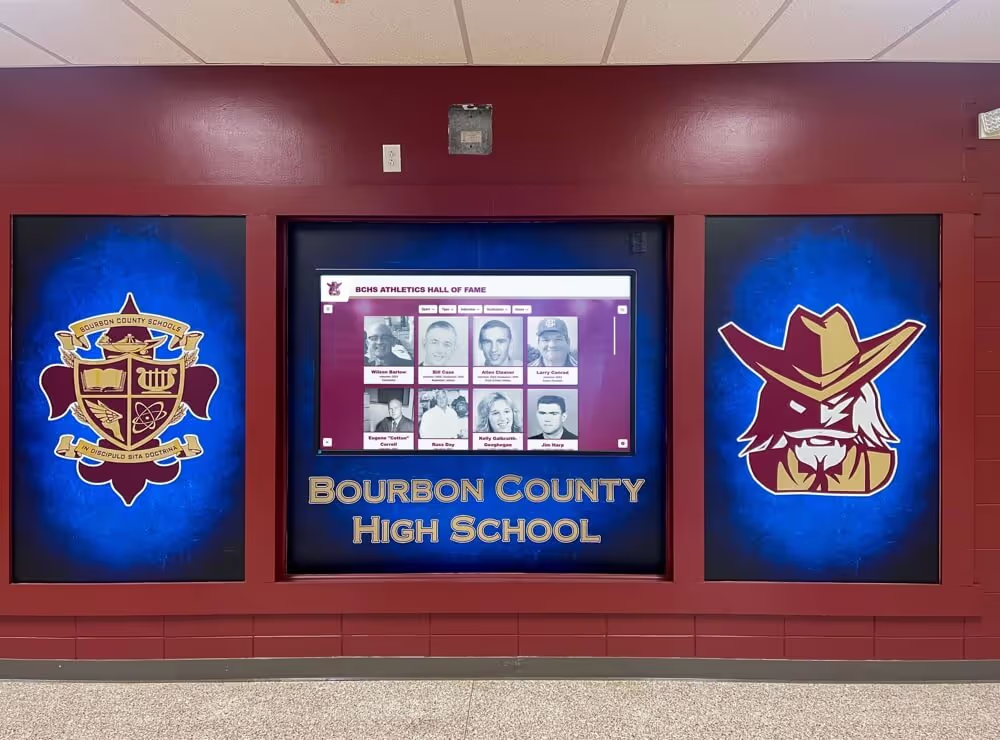
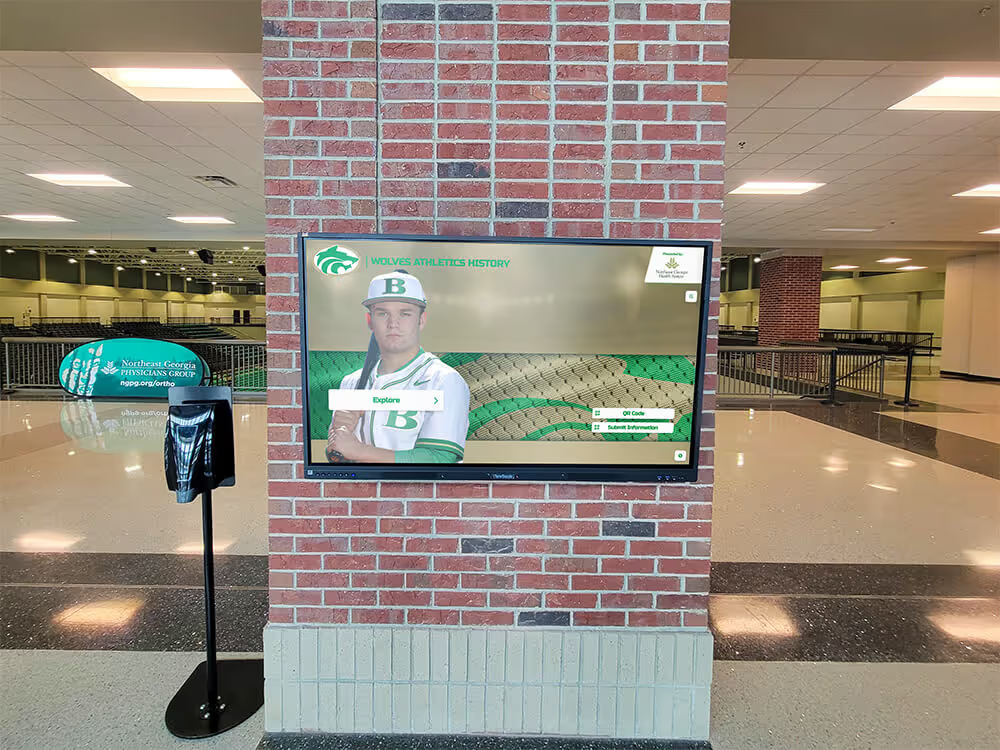
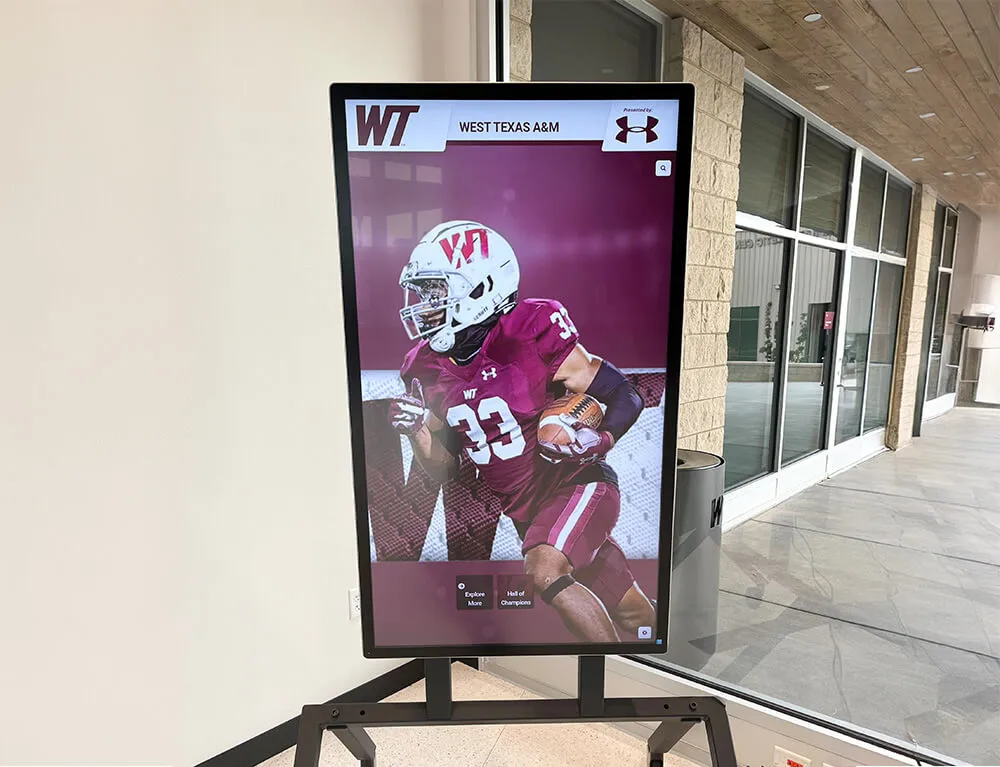
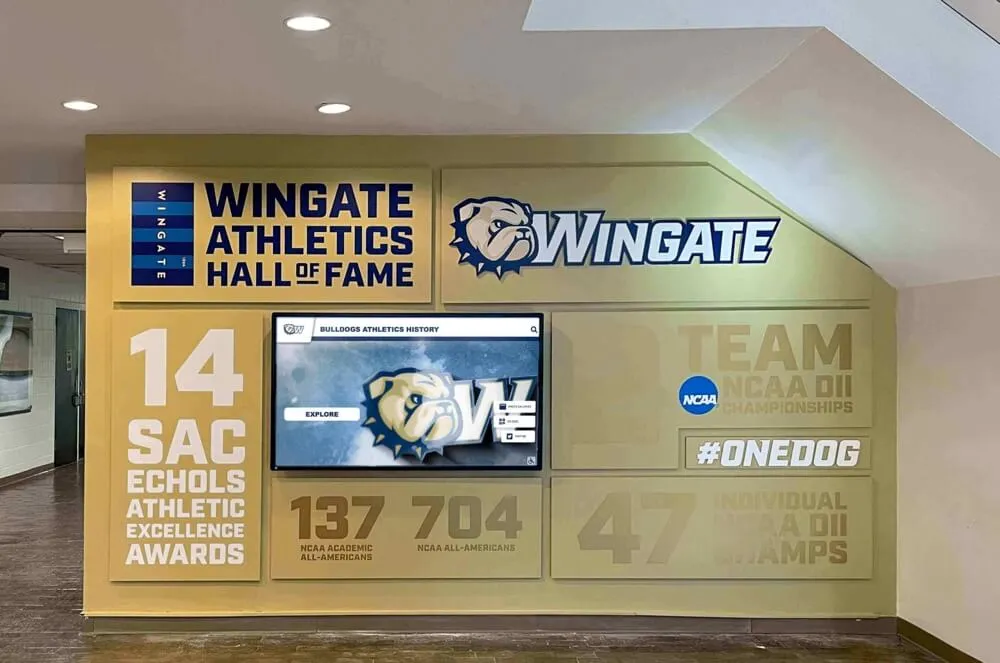
Implementing a digital Wall of Fame is just the beginning. To truly maximize its value and demonstrate its impact to stakeholders, you need a systematic approach to measuring success. This comprehensive guide explores the essential metrics, analytics tools, and benchmarking strategies that will help you track performance, optimize engagement, and prove the ongoing value of your digital recognition system.
Why Measuring Success Matters
Many institutions invest tens of thousands of dollars in digital recognition systems without establishing clear success metrics. This oversight makes it difficult to:
- Justify the initial investment to stakeholders
- Identify opportunities for improvement
- Demonstrate ongoing value to decision-makers
- Optimize content strategies based on data
- Track progress toward institutional goals
By implementing a robust measurement framework, you transform your digital Wall of Fame from a static investment into a continuously improving asset that delivers measurable returns.
Understanding Success Across Multiple Dimensions
Success for a digital Wall of Fame isn’t one-dimensional. A comprehensive measurement strategy evaluates performance across several key areas:
Engagement Metrics
How actively are visitors interacting with your display? These metrics reveal whether your content captures attention and encourages exploration.
Content Performance
Which profiles, categories, and features generate the most interest? Understanding content effectiveness guides future additions.
Technical Performance
Is your system reliable, responsive, and accessible? Technical metrics ensure your display operates smoothly.
Strategic Impact
How does your digital Wall of Fame contribute to broader institutional goals like alumni engagement, fundraising, and recruitment?
Essential Engagement Metrics to Track
Engagement metrics form the foundation of your measurement strategy, revealing how visitors interact with your digital recognition system.
Session Duration and Depth
Average Session Length measures how long visitors spend interacting with your display. Industry benchmarks suggest:
- Under 1 minute: Low engagement, likely browsing without meaningful interaction
- 2-4 minutes: Moderate engagement, casual exploration
- 5+ minutes: High engagement, active content discovery
Pages Per Session indicates exploration depth:
- 1-2 pages: Minimal engagement
- 3-5 pages: Moderate exploration
- 6+ pages: Deep engagement with multiple profiles or categories
Track these metrics over time to identify trends. A well-designed system with compelling content typically sees average session lengths increase during the first 6-12 months as awareness grows and content expands.
Interaction Patterns
Touch/Click Heatmaps reveal which screen areas attract the most attention. Modern analytics platforms can show you:
- Most frequently tapped buttons and navigation elements
- Popular entry points into your content
- Areas visitors ignore or overlook
- Optimal placement for calls-to-action
Search Behavior provides insights into visitor intent:
- Most common search queries
- Search success rates
- Popular filters (by sport, year, achievement type)
- Navigation pathways through search results
Understanding search patterns helps you optimize your information architecture and ensure visitors can easily find content that matters to them.
Return Visit Rates
Repeat Visitor Percentage measures whether your display has lasting appeal beyond initial curiosity:
- 10-15%: Expected for casual recognition displays
- 20-30%: Strong performance indicating compelling, regularly updated content
- 35%+: Exceptional performance, often driven by event-based traffic or active social sharing
Return visits often spike around key events like homecoming, reunions, athletic competitions, and new honoree announcements. Track these patterns to inform your content calendar.
Measuring Content Performance
Not all content performs equally. Analytics reveal which profiles, categories, and features resonate most with your audience.
Most Viewed Profiles and Categories
Track which honoree profiles receive the most views to understand visitor interests:
- Recent graduates often generate high traffic from current students and their families
- Distinguished alumni with notable achievements attract broader interest
- Local community figures may drive engagement from non-alumni visitors
- Athletic achievements frequently dominate views at sports-focused institutions
Use these insights to guide future content development. If certain categories consistently outperform others, consider expanding those areas or promoting similar content more prominently.
Multimedia Engagement
Different content types generate varying levels of engagement:
Video Content:
- Track completion rates (what percentage of viewers watch the entire video)
- Average watch time for longer videos
- Video views compared to static profile views
Typically, short videos (30-90 seconds) see completion rates of 60-75%, while longer videos (3+ minutes) may see completion rates of 25-40%.
Photo Galleries:
- Images viewed per gallery session
- Time spent viewing photos
- Most popular historical images
Photo galleries with 8-15 high-quality images typically generate the highest engagement, as this range provides variety without overwhelming visitors.
Interactive Features:
- Timeline exploration patterns
- Map interaction rates
- Achievement filter usage
- Social sharing frequency
These advanced features often see lower overall usage (15-30% of visitors) but generate disproportionately longer session times among those who engage with them.
Search and Discovery Analytics
Popular Search Terms reveal what visitors are looking for:
- Individual names (often from recent graduating classes)
- Specific sports or activities
- Achievement types (championships, academic honors)
- Years or decades
Search Refinement Patterns show how visitors narrow their search:
- Initial broad searches followed by specific filters
- Common filter combinations (e.g., “basketball” + “2010s”)
- Zero-result searches that indicate missing content or terminology mismatches
If certain searches consistently return no results, this signals content gaps or tagging issues that need addressing.
Technical Performance Indicators
Even the most engaging content fails if technical issues prevent access. Monitor these critical technical metrics:
System Uptime and Reliability
Uptime Percentage should exceed 99.5% for professional installations:
- 99.9%+: Excellent performance, minimal disruption
- 99.0-99.5%: Acceptable with occasional issues
- Below 99%: Problematic, requiring immediate attention
Track downtime incidents by duration and cause:
- Network connectivity issues
- Hardware failures
- Software updates or crashes
- Power interruptions
Solutions like Rocket Alumni Solutions typically include monitoring systems that alert administrators to technical issues before visitors encounter problems.
Response Time and Performance
Touch Response Time measures the delay between touch and screen response:
- Under 100ms: Excellent, feels instantaneous
- 100-300ms: Acceptable for most interactions
- Over 300ms: Noticeable lag that degrades user experience
Content Load Times affect perceived performance:
- High-resolution images should load within 1-2 seconds
- Video playback should begin within 2-3 seconds
- Search results should appear within 1 second
Monitor load times for different content types and optimize files that consistently load slowly. Large images should be compressed without sacrificing visual quality, and videos should be encoded efficiently.
Accessibility Metrics
ADA Compliance Indicators ensure your display serves all visitors:
- Screen reader compatibility for online versions
- Sufficient color contrast ratios (minimum 4.5:1 for text)
- Touch target sizes meeting minimum standards (44x44 pixels)
- Keyboard navigation functionality for web-based versions
Track accessibility feature usage when available:
- Text-to-speech activation rates
- Font size adjustment usage
- High-contrast mode engagement
These metrics help justify accessibility investments and identify areas for improvement. For guidance on creating accessible displays, see our article on digital wall of fame accessibility.
Strategic Impact Metrics
The ultimate measure of success is how your digital Wall of Fame contributes to broader institutional objectives.
Alumni Engagement Impact
Alumni Contact Updates generated through the display:
- Number of profile updates submitted
- New email addresses collected
- Social media connections established
- Newsletter sign-ups from display interactions
Track alumni engagement beyond the display itself:
- Event attendance increases following display implementation
- Alumni directory engagement growth
- Social media mentions and shares of display content
- Website traffic to alumni pages from display-related campaigns
Many institutions report 15-25% increases in alumni engagement metrics within the first year after implementing an interactive recognition system.
Fundraising Correlation
While multiple factors influence giving, track potential correlations between your display and development outcomes:
Donor Recognition Engagement:
- Views of donor recognition sections
- Time spent exploring giving levels and benefits
- Clicks on donation calls-to-action embedded in the display
Giving Trends Post-Implementation:
- Year-over-year changes in alumni giving participation
- Average gift size changes
- First-time donor rates
- Lapsed donor reactivation
While establishing direct causation is challenging, many institutions using digital donor recognition displays report measurable improvements in development metrics. Document these correlations even when you cannot prove causation, as they provide valuable context for stakeholder reports.
Recruitment and Visitor Impact
Campus Tour Integration:
- Percentage of campus tours that include the display as a stop
- Tour guide feedback on visitor reactions
- Prospective student survey mentions of the display
- Social media posts from campus visitors featuring the display
Visitor Center Traffic:
- Overall visitor count changes after display installation
- Peak usage times and seasonal patterns
- Average time visitors spend in recognition areas
- Comments and feedback from guest books or surveys
Track how your digital Wall of Fame influences institutional perception among prospective students, families, and community members. Even small improvements in tour feedback scores can represent significant value when multiplied across hundreds of annual visitors.
Setting Up Your Analytics Infrastructure
Effective measurement requires the right tools and systematic data collection processes.
Built-In Platform Analytics
Most modern digital recognition platforms include native analytics dashboards. When evaluating or configuring your system, ensure it tracks:
- Daily, weekly, and monthly active users
- Session duration and page view statistics
- Popular content and search terms
- Geographic data (if network-connected with user location)
- Peak usage times and traffic patterns
Solutions like those offered by Rocket Alumni Solutions typically provide comprehensive analytics without requiring third-party tools. This integrated approach simplifies data access and ensures metrics are specifically relevant to recognition displays.
Supplementary Analytics Tools
Depending on your setup, you may want to integrate additional analytics:
For Web-Based Companion Sites:
- Google Analytics for detailed traffic analysis
- Heatmap tools like Hotjar for visual interaction data
- Social media analytics for share and engagement tracking
For Feedback Collection:
- QR code-based survey tools displayed near the kiosk
- Email feedback collection integrated into profile update forms
- Social listening tools to track online mentions
For Development Correlation:
- CRM integration to track donor engagement with recognition features
- Event management system connections to measure registration impacts
- Alumni database synchronization for profile update tracking
Establishing Baseline Measurements
Before you can measure improvement, you need baseline data. In your first 90 days, focus on:
- Recording Initial Metrics: Capture starting points for all key performance indicators
- Identifying Patterns: Note daily and weekly usage trends
- Testing Variations: Experiment with content placement and featured profiles
- Gathering Qualitative Feedback: Collect anecdotal observations from visitors and staff
This baseline period provides context for future performance evaluation. Don’t expect optimal engagement immediately, as awareness and word-of-mouth take time to build.
Benchmark Standards and Performance Goals
Understanding how your metrics compare to similar institutions helps contextualize performance and set realistic goals.
Engagement Benchmarks by Institution Type
K-12 Schools:
- Average session duration: 2.5-4 minutes
- Return visitor rate: 15-22%
- Peak usage: Before/after school, during athletic events
- Popular content: Recent graduates, athletic achievements, academic honors
Colleges and Universities:
- Average session duration: 3.5-6 minutes
- Return visitor rate: 18-28%
- Peak usage: Homecoming, reunions, prospective student visits
- Popular content: Distinguished alumni, historical milestones, career achievements
For more specific examples of successful implementations, explore how various institutions have leveraged interactive touchscreen solutions.
Corporate Recognition Programs:
- Average session duration: 2-4 minutes
- Employee engagement rate: 30-50% monthly
- Peak usage: Around new hire orientation, company milestones
- Popular content: Leadership profiles, milestone anniversaries, team achievements
Sports Organizations and Athletics:
- Average session duration: 4-7 minutes
- Fan engagement: 20-35% of facility visitors
- Peak usage: Game days, tournaments, hall of fame induction events
- Popular content: Championship teams, record holders, statistical leaders
For sports-specific implementations, see comprehensive guidance on digital record boards that track athletic achievements.
Setting Realistic Growth Targets
Year-over-year growth expectations vary by maturity stage:
Year 1 (Implementation Phase):
- Focus on building awareness and establishing baseline metrics
- Expect gradual usage increases as word spreads
- Target: 10-15% quarterly growth in active users
Year 2 (Optimization Phase):
- Refine content strategy based on first-year data
- Expand content breadth and depth
- Target: 20-30% annual growth in engagement metrics
Year 3+ (Maturity Phase):
- Sustain high engagement through regular content updates
- Introduce new features based on user feedback
- Target: 10-15% annual growth with seasonal variations
Remember that quality matters more than quantity. A display with 50 highly engaged daily users provides more value than one with 200 superficial interactions.
Creating Effective Stakeholder Reports
Data only creates value when communicated effectively to decision-makers. Structure your reporting around stakeholder priorities:
Monthly Internal Reports
For operational teams and content managers:
- Engagement Snapshot: Key metrics compared to previous month and year-ago period
- Content Performance: Top 10 most viewed profiles and categories
- Technical Issues: Uptime percentage, resolved issues, ongoing concerns
- Action Items: Recommended content additions or feature improvements
Keep monthly reports concise (1-2 pages) and focus on actionable insights rather than comprehensive data dumps.
Quarterly Strategic Reports
For leadership and key stakeholders:
- Executive Summary: High-level performance overview with key achievements
- Trend Analysis: Quarter-over-quarter growth patterns and seasonal variations
- Strategic Alignment: How display metrics connect to institutional goals
- Success Stories: Specific examples of impact (alumni reconnections, donor engagement, visitor feedback)
- Future Recommendations: Proposed enhancements or content initiatives
Include visual data representations (charts, graphs, heatmaps) to make trends immediately apparent. For guidance on demonstrating value to stakeholders, see insights on measuring digital hall of fame success.
Annual Comprehensive Reviews
For board presentations and budget justification:
- Year-in-Review: Complete performance summary across all metrics
- ROI Analysis: Financial and strategic value delivered
- Comparative Benchmarking: How your performance compares to similar institutions
- Testimonials and Qualitative Impact: Stories that illustrate quantitative data
- Multi-Year Roadmap: Strategic vision for continued improvement
Annual reports justify continued investment and build the case for expansion or enhancement projects.
Optimization Strategies Based on Data
Analytics only create value when insights drive action. Use your data to continuously improve performance:
Content Strategy Adjustments
If certain categories underperform:
- Review content quality and media richness
- Consider better promotion through featured placements
- Add more diverse examples within that category
- Survey stakeholders about content preferences
If engagement drops during specific periods:
- Schedule timely content updates before slow periods
- Create seasonal content campaigns (e.g., homecoming spotlights)
- Promote the display through other channels during low-traffic times
If search queries return no results:
- Expand tagging and metadata for existing content
- Identify and fill content gaps
- Improve search algorithm to handle variations and synonyms
User Experience Improvements
If session duration is below benchmarks:
- Enhance visual design to create stronger first impressions
- Add more prominent navigation cues
- Introduce featured content to guide exploration
- Incorporate interactive elements that encourage discovery
If return visit rate is low:
- Increase content update frequency and promote new additions
- Add “What’s New” sections highlighting recent profiles
- Implement notification systems for interested alumni
- Create reason for repeat visits through changing featured content
For comprehensive guidance on enhancing user experience, see our implementation guide covering design and deployment best practices.
Technical Performance Enhancements
If load times exceed acceptable ranges:
- Optimize and compress media files
- Upgrade network connectivity if bandwidth-constrained
- Implement content caching strategies
- Consider content delivery network (CDN) for web components
If uptime falls below target:
- Investigate and resolve recurring technical issues
- Implement redundancy for critical components
- Establish proactive monitoring and alerting
- Develop rapid response protocols for outages
Advanced Analytics: Going Beyond Basic Metrics
As your measurement practice matures, consider these advanced analytical approaches:
Cohort Analysis
Track how different user groups engage with your display over time:
- Recent graduates vs. alumni from earlier decades
- First-time visitors vs. returning users
- Visitors during special events vs. regular traffic
- Different times of day or days of week
Cohort analysis reveals whether different segments require tailored content or promotion strategies.
Attribution Modeling
For institutions with multiple touchpoints, attempt to track the display’s role in the broader engagement journey:
- Alumni who view the display and subsequently attend events
- Donors who engage with recognition content before giving
- Prospective students who mention the display in enrollment surveys
- Social media engagement stemming from display visits
While perfect attribution is impossible, directional insights help demonstrate strategic value.
Predictive Analytics
With sufficient historical data, identify leading indicators of success:
- Content characteristics that predict high engagement
- Traffic patterns that precede donation spikes
- User behaviors associated with profile update submissions
- Seasonal trends that enable proactive content planning
Advanced analytics transform your measurement from reactive reporting to proactive optimization.
Common Measurement Challenges and Solutions
Even with robust analytics, you’ll encounter measurement obstacles:
Challenge: Difficulty attributing alumni engagement or donations directly to the display Solution: Track correlations and timing rather than claiming causation. Survey alumni about their engagement journey and what influenced their actions.
Challenge: Limited analytics capabilities in current platform Solution: Supplement with manual tracking, periodic surveys, and qualitative observation. When evaluating system upgrades, prioritize platforms with comprehensive built-in analytics.
Challenge: Seasonal variations make trends difficult to interpret Solution: Compare performance to the same period in previous years rather than to the previous month. Establish multi-year baselines that account for natural seasonality.
Challenge: Stakeholders dismiss engagement metrics as “vanity metrics” Solution: Always connect engagement data to strategic outcomes. Frame metrics in terms of what they enable (e.g., “3,500 alumni reconnections” rather than “3,500 profile views”).
Creating a Continuous Improvement Culture
Measurement is not a one-time activity but an ongoing process:
- Regular Review Cadence: Establish monthly data review sessions with your content team
- Experimental Mindset: Test new content types, layouts, and features systematically
- Feedback Integration: Actively solicit and incorporate user feedback alongside quantitative data
- Benchmark Tracking: Monitor how your performance evolves relative to industry standards
- Strategic Alignment: Regularly revisit how display metrics connect to institutional priorities
Organizations that embrace continuous measurement and optimization typically see sustained engagement growth and increasing strategic value over time.
Conclusion: From Data to Decisions
Measuring the success of your digital Wall of Fame transforms it from a static installation into a dynamic, continuously improving asset. By tracking the right metrics, interpreting data within appropriate context, and using insights to drive ongoing optimization, you maximize both the immediate impact and long-term value of your investment.
The institutions that achieve the greatest success with digital recognition aren’t necessarily those with the largest budgets or most elaborate systems. They’re the organizations that systematically measure performance, learn from data, and continually refine their approach based on evidence.
Start with the core engagement and content metrics outlined in this guide. As your measurement practice matures, expand into strategic impact analysis and advanced analytics. Most importantly, ensure your measurement efforts drive action—data without decisions creates no value.
Ready to implement a digital Wall of Fame with built-in analytics and comprehensive reporting? Rocket Alumni Solutions provides platforms specifically designed for measurable recognition excellence, with intuitive dashboards that make tracking success simple and actionable.
Effective measurement is the difference between justifying an expense and demonstrating an investment. Start tracking today, and let the data guide your path to recognition excellence.


